


EU-Korea FTA
To test this prediction, we decided to carry out a study by focusing, in particular, on one agreement and on the use of preferential treatment at HS chapter level (first 2 digits of commodity tariff codes). We chose the agreement between the Republic of Korea and the European Union (EU) and examined operations involving EU importers in 2022. Given that the European Commission has the exclusive mandate to negotiate trade deals for the EU 27 Member States, PTA-specific administrative requirements and preferential margins are identical across all EU countries. We would thus expect no significant variation in the utilization rates of preferential treatment across the 27 EU Member States for the same product imported from Korea.
Using data on preference-eligible imports and on imports that ultimately entered under the preferential rate, we calculated the preference utilization rates (PURs) for each HS chapter and for each EU Member State. Figure 1 illustrates the range of preference utilization across EU countries’ imports from the Republic of Korea by HS chapter. Each line represents the interquartile range (statistical distribution) of the Member States’ utilization rates in a particular HS chapter. Shorter lines mean that utilization in this chapter is similar across all 27 Member States. In contrast, longer lines indicate a high variation in a product utilization rate across EU countries.
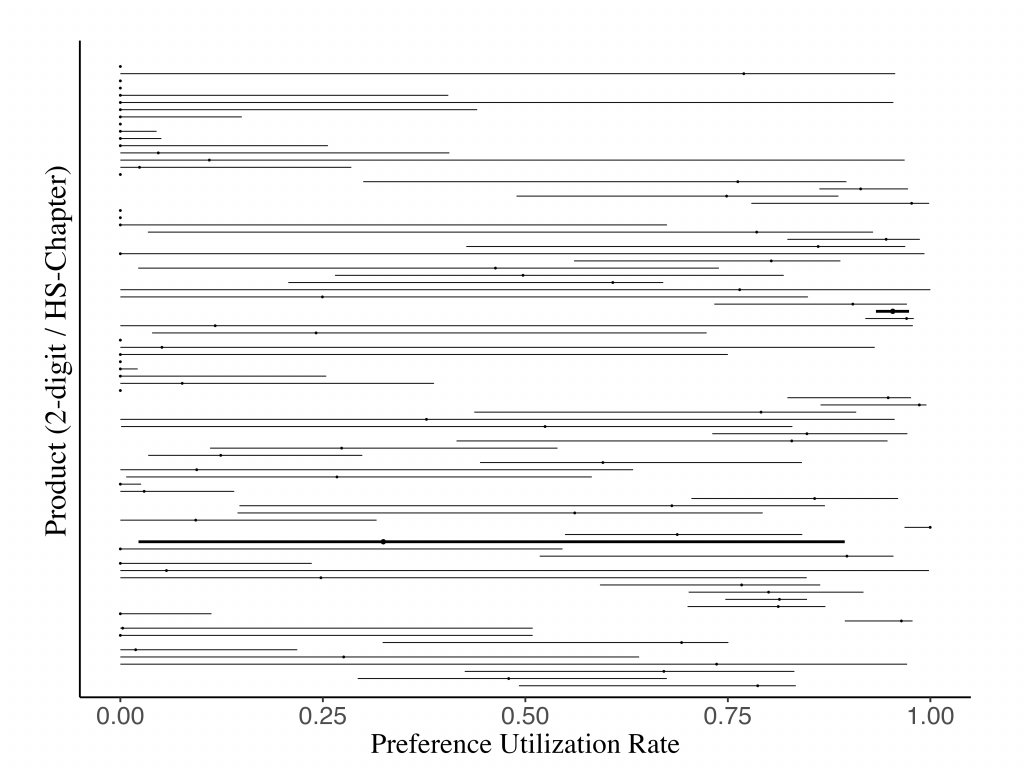
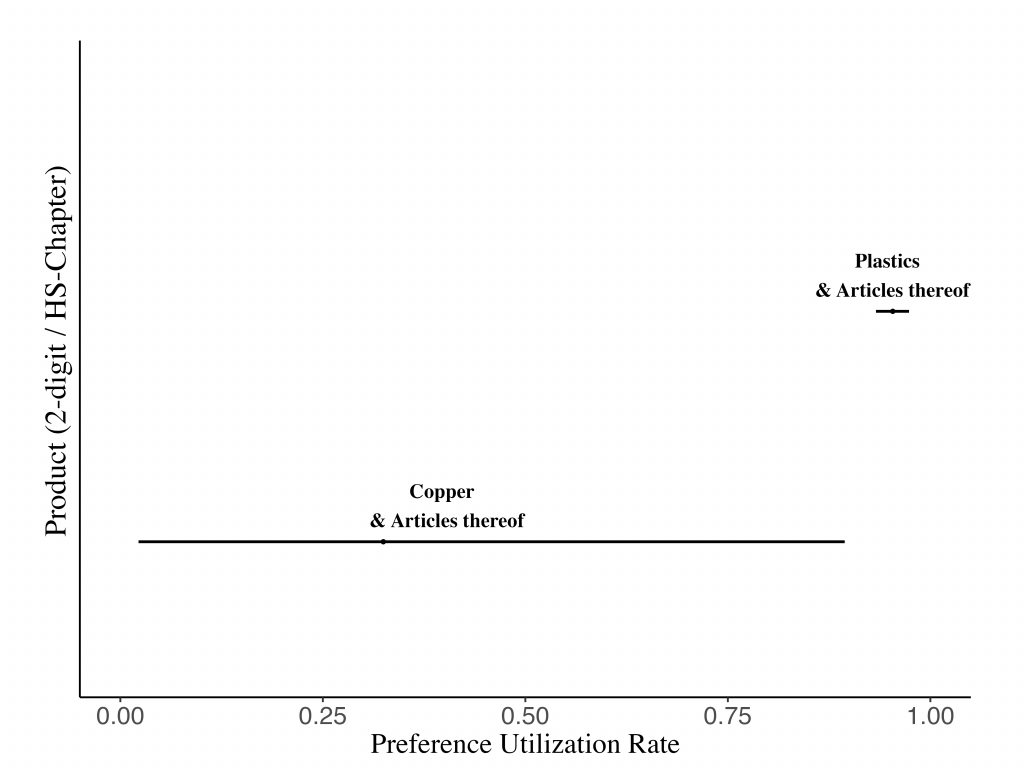
We then compared figures related to the imports of two categories of products from South Korea: HS Chapter 39 (Plastics and articles thereof) and HS Chapter 74 (Copper and articles thereof). For plastics, the rate of utilization of available preferences was relatively high – between 93% and 97% (with a median rate of 95%). However, for copper, the utilization rate varied much more widely – from just 2% to 90% (the median rate being below 34%). Taken together, we can conclude that the utilization of available preferences for products of Chapter 39 was generally high, and the variation of utilization rates across EU countries was reasonably small, which means that traders in most countries make similar use of the available preferences. This can be logically expected and is in line with our theoretical prediction, as firms in all EU countries are exposed to the same administrative requirements and have access to the same benefits.
In contrast, the utilization rates for Chapter 74 are much lower and more spread out: while traders in some countries make good use of available preferences, traders in other countries hardly use them at all. This is at odds with the above theoretical prediction.
Looking at Figure 1 again, and in comparison with other HS chapters, we can observe that the first example (Chapter 39) represents more of an exception, while the second example (Chapter 74) appears to be more of a rule. This means that, despite administrative requirements and preferential margins being identical, utilization rates for the same product often vary significantly across EU Member States.
Takeaways
This analysis offers two key takeaways. Firstly, preference utilization varies significantly across products. As the administrative requirements for proving compliance with preferential rules of origin are the same across the EU, the observed variation appears to be driven mostly by the interplay between the preferential margins and the stringency of rules of origin requirements, which make the utilization of preferential rates more appealing in some HS chapters compared to others.
Secondly and more importantly for this study, even though preferential margins and rules of origin requirements are identical across the EU, there exists a significant variation in preference utilization for the same product across importing EU countries. Similar patterns were observed when conducting the analysis for HS headings (first 4 digits of tariff codes) or HS subheadings (first 6 digits of tariff codes). An exclusive focus on product-level determinants therefore fails to explain the significant cross-country variation in utilization rates within the same product category.
Widening the study scope
This finding naturally leads to the question of whether firms in some countries are systematically better at utilizing equivalent preferences. To answer this question, we analysed the distribution of preference utilization rates across all EU PTAs and EU Member States. The initial analysis suggests that there are traders in some EU countries that make generally good use of preferential tariff rates. For example, in 2022, the rate of utilization of PTAs by importers based in Greece fell between 90% and 100%. In contrast, the rate of utilization by importers in other countries is not only generally lower, but also shows a much higher variability depending on the agreement. While some PTAs in those countries remain well utilized with a utilization rate often reaching around 90%, others are much less used, with rates ranging between 50% and 60%.
To rationalize these significant cross-country differences, our study suggests two possible explanations:
Private-sector experience
As part of the study, we interviewed importers and analysed specific transactions. One of our findings is that national Customs authorities within the EU have a significant discretionary power to determine what specific documentary evidence should be submitted by importers in order to benefit from preferential duty rates.
Firstly, Customs authorities would have to decide whether there are reasons to believe that the importer did not comply with the rules and whether further information is needed. Dealing with identical or similar cases, some administrations would consider the importer as compliant, while others, following a stricter approach or simply having more capacity to carry out extra checks, would require that the importer produce additional information.
Secondly, as all situations are different, EU Member States’ Customs authorities have the discretion to decide which evidence is to be provided by importers. There is no centrally managed and fully harmonized list of documents that can be requested and accepted by all EU Customs administrations in that regard.
These realities should also be taken into consideration when examining the rates of utilization of preferences.
Way forward
The study concludes by offering two main paths for further research.
First, we show that the existing explanations for under-utilization at product level are insufficient to demystify the reasons for significant cross-country differences in preference utilization. Based on the figures obtained during the study, we suggest focusing more attention on the work of national Customs authorities and their interactions with traders in the quest for a better understanding of the phenomenon of under-utilization of preferential trade agreements.
Second, on a more general level, our current research is intended as a call for a more comprehensive investigation into preference utilization, one that goes beyond product-specific features and incorporates the role of all relevant stakeholders. This effort will require increased cooperation between academia and both public- and private-sector stakeholders.
More information
sa.egb@cbs.dk
lars.karlsson@maersk.com
[1] WTO, Regional trade agreements database, 1 2024, https://rtais.wto.org/UI/PublicMaintainRTAHome.aspx.