India’s trade facilitation journey: viewed through the lens of the National Time Release Study
24 June 2024
By Vijay Singh Chauhan, Principal Commissioner of Customs (Retd) and Sruti Vijayakumar, Deputy Commissioner of Customs at the Central Board of Indirect Taxes & Customs, IndiaInternational trade has long played a crucial role in promoting economic development and fostering poverty alleviation among the least developed and developing economies. Countries, economic groupings and the World Trade Organization (WTO), recognizing the beneficial impact of fair and equitable international trade, have been pursuing various initiatives to promote international trade. One such initiative is the successful negotiation and ongoing implementation of the WTO’s Trade Facilitation Agreement (TFA), encompassing “simplification, modernization, and harmonization of export and import processes”.
India’s National Committee on Trade Facilitation (NCTF), set up to steer implementation of the TFA commitments, drew up a time-bound National Trade Facilitation Action Plan (NTFAP) for this purpose. The NTFAP also included initiatives for infrastructural development and information technology augmentation, which are not covered by the TFA, under the rubric of “TFA Plus” measures, in view of their role in trade facilitation.
One of the motivations guiding the TFA was a WTO estimate that full implementation of the TFA could reduce trade costs by an average of 14.3% and boost global trade by up to USD 1 trillion per year, with the biggest gains accruing in the poorest countries[1].
While trade facilitation reduces trade costs both directly and indirectly, inter alia, through reduction in trade time, it has long been recognized that trade time is more amenable to measurement. In this regard, the World Customs Organization (WCO) has developed the Time Release Study (TRS) as a tool to measure trade time. In recognition of the importance of performance measurement and the appropriateness of the TRS as a tool for its measurement, Article 7.6 of the TFA provides for “Establishment and Publication of Average Release Times”[2].
The said Article encourages members “to measure and publish their average release time of goods periodically and in a consistent manner, using tools such as, inter alia, the Time Release Study of the World Customs Organization”, and encourages them “to share with the Committee their experiences in measuring average release times, including methodologies used, bottlenecks identified, and any resulting effects on efficiency.”
India has been at the forefront of trade facilitation, having fulfilled all its commitments within the stipulated time by February 2022[3]. Simultaneously, India has been conducting annual TRS, initially at Jawaharlal Nehru Custom House (JNCH), the largest in the country, catering for the Jawaharlal Nehru Port Authority – the 30th largest containerized port in the world. Since 2021, the TRS is conducted annually at the national level, covering 15 major seaports, inland dry ports (which are formally called Inland Container Depots (ICDs)), Air Cargo Complexes (ACCs) and land Customs stations – called Integrated Check Posts (ICPs). In addition, India has been sharing these formal studies in the public domain[4], reporting the same to the WTO Trade Facilitation Committee[5], and with early JNCH TRS 2018 being included in the Members’ Experience section of the WCO TRS Guide 2018[6].
In this article, the authors build upon the previous one, titled Assessing the clearance process: India shares its experience, which was published in 2018[1] and which presented major highlights of India’s early experience in measuring average release times, including methodologies used, bottlenecks identified, and resulting effects on efficiency.
What gets measured, gets done
The Indian Government had recognized the importance of trade facilitation and the performance measurement thereof relying on various indicators. The co-authors of this article, Vijay Singh Chauhan and Sruti Vijayakumar, had delved into various publicly available trade facilitation indicators relating to India in a paper titled Measuring Trade Facilitation: Evidence from India[2]. Analysing the results of six composite performance indicators for India, they had highlighted greater robustness of cargo release time trends, based particularly on technology-enabled data-driven studies as a more meaningful metric for measurement of performance of border-management agencies and practices vis-à-vis survey or perception-based indicators representing “enablers” of trade facilitation. In the paper, the co-authors provided strong support for the use of cargo release time, as recommended by the WCO and WTO, as a preferred performance indicator for trade facilitation.
An obvious concomitant to regular performance measurement is to prescribe precise and reasonable targets. Accordingly, the NTFAP has, inter alia, prescribed average release time targets of 48 hours and 24 hours respectively for import and export through seaport, dry port and Land Customs Stations; and 24 hours and 12 hours respectively for import and export through air cargo. The NCTF also mandated the Central Board of Indirect Taxes and Customs (CBIC) to lead the conduct of National TRS (NTRS).
Therefore, CBIC has been conducting annual studies since 2019, based on detailed analyses of bills of entry (import declaration) and shipping bills (export declaration) submitted during the first week of the calendar year, following a standardized methodology that has evolved through local port-specific TRS, particularly the JNCH TRS mentioned earlier, and Air Cargo Complex Mumbai TRS 2020.
CBIC also publishes less detailed, but higher frequency average release time reports, drawing upon comprehensive transaction-level data with the Customs automated system, the platform where import and export declarations are submitted and processed:
- Monthly Dwell Time Report[3] (DTR) for import, since July 2015, covering all bills of entry submitted with a three-month lag.
- ICEDASH[4] – Daily Performance Tracker for imports and exports, which covers the bills of entry or shipping bills given clearance on any given day with a one-day lag.
Since the NTRS is the most comprehensive and insightful of these reports, the focus of this paper is restricted to TRS findings, noting that NTRS findings based on one-week sample data are an unbiased indicator of annual performance trends.
India’s TRS journey – making great strides
In India, initial efforts to regularly measure average release time started in 2013[5] through JNCH TRS. As trade facilitation initiatives advanced, so too did the sophistication of measurement methods, notably through the adoption of annual TRS tracking the processing of bills of entry lodged and shipping bills submitted in the country during a one-week sample period. JNCH again pioneered the conduct of such annual TRS in 2017, following the implementation of the TFA. TRS 2018 adopted the definition of average release time that is consistent with the WCO’s definition of cargo release time as the arithmetic mean of the time taken between arrival of the cargo, approximated by the grant of entry inwards of the vessel at the port, and its final release into the economy, approximated by the grant of out of charge by Customs; with lower release time indicating better performance. CBIC has since progressed from port-level TRS to conducting NTRS, adopting the standardized methodology developed at JNCH.
Import Release Time – consistent improvement
With NTRS 2024 currently under preparation, the paper relies on NTRS 2023 to present average export and import release time data for four modes of trade, based on a sample study of four seaports, six air cargo complexes, three Inland Container Depots (ICDs) and two Integrated Check Posts (ICPs), spread across the country and collectively accounting for approximately 80% of the bills of entry and 70% of the shipping bills submitted in the country.
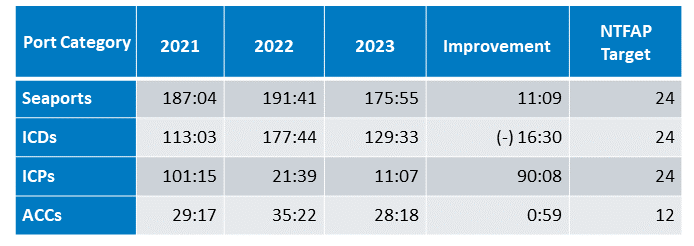
It is evident that focused endeavours aimed at trade facilitation, encompassing the full implementation of all provisions outlined in the TFA and guided by WCO instruments, have resulted in noticeable improvement in average import release times across all port categories, as summarized below.

Average import release time for JNCH has been included to show the significant improvement that may be likely to have taken place at other ports/categories. The reported substantial improvements are a result of a slew of measures, including fulfilment of all the TFA commitments focusing on harmonizing and streamlining the cargo clearance processes, wider adoption of technology, and concerted outreach to ensure trader participation in the trade facilitation measures.
NTRS 2023 also concluded that “the improvement in the average release time is also accompanied by lower standard deviation, thereby providing greater assurance of expedited cargo clearance”[12]. However, it is evident that despite commendable achievements, the NTFAP targets have not been met at the end of the second NTFAP covering 2020-2023. These studies have, therefore, attempted to identify the successful measures and, more importantly, the challenges and constraints being faced.
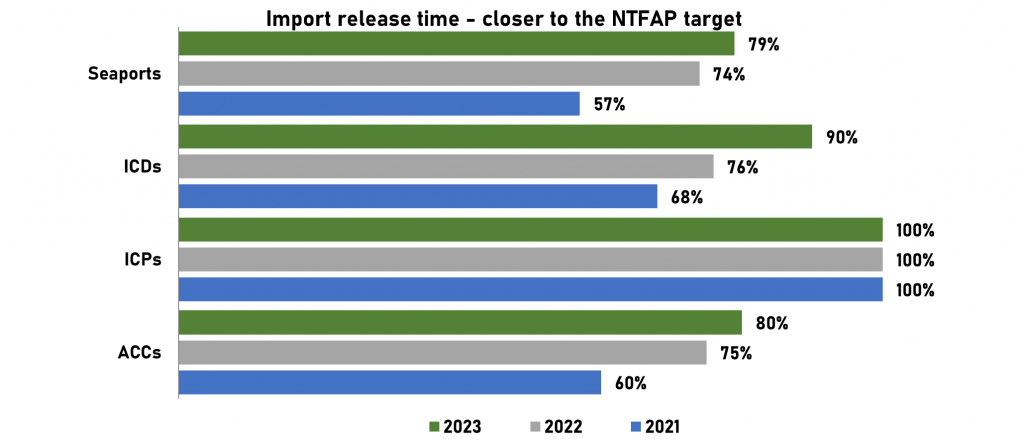
Before discussing these in the next section, the progress reported in terms of an alternate performance indicator, viz. “Distance travelled towards NTFAP target”, is briefly reported. This indicator, which computes the percentage share of fastest bills of entry for which average release time is within the applicable NTFAP target, also shows significant improvement.

“Path to Promptness”
JNCH TRS 2018 had identified a four-fold “Path to Promptness”, comprising:
- pre-arrival processing by filing of bills of entry before arrival of the cargo;
- risk-based facilitation of self-declared bills of entry without any manual documentary verification or physical examination;
- enrolment under the trust-based Authorized Economic Operator (AEO) scheme; and
- Direct Port Delivery (DPD) scheme, introduced at Container Freight Stations-based seaports, that allows the facilitated consignments to be given out of charge directly from the terminal premises.
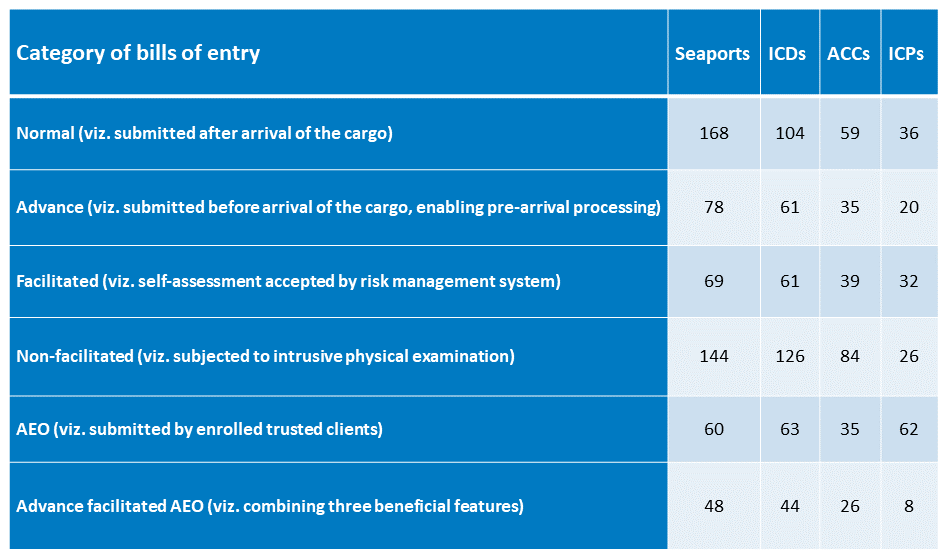
Subsequent studies continued to track the progress and affirmed the positive impact of these four measures. These impacts are summarized in the table below.

Ensuring pre-arrival processing – a TFA and WCO Revised Kyoto Convention (RKC) recommendation – through submission of advance bills of entry is a major tool for reduction in the cargo release time. Simultaneously, by integrating advanced data analytics with human intelligence[13], the CBIC risk management system has made it possible to expedite cargo release. Together, these have brought about an impressive improvement in the average release time.
Acknowledging the crucial role of trust-based trade facilitation, CBIC had introduced a revamped three-tiered Authorized Economic Operator (AEO) scheme in 2016 to provide a slew of graded benefits, including: (i) higher levels of facilitation; (ii) more expeditious cargo release; (iii) greater certainty of expeditious clearance; and (iv) lower costs through deferred duty payment and waiver from bank guarantees. The average release time for advance facilitated bills of entry submitted by AEOs has met the NTFAP target release time for all four port categories. However, despite the above-mentioned benefits, trader response to these enabling provisions, as reflected in the share of bills of entry submitted by AEO clients in the NTRS sample of bills of entry stagnating at about 35%, has been less than complete, and particularly lukewarm for the AEO scheme. Therefore, recent NTRS have delved deeper into these constraining features, which are discussed in the next section.
Impact-dissipating actions and the story of the fat tail
NTRS 2023 identified two major impact-dissipating actions that dampen the beneficial impact of various trade facilitative measures:
- delays in payment of duty; and
- amendments to the import declaration post-submission.
It also identified a statistical phenomenon called “fat tail”, entailing greater likelihood of extreme events occurring than under a normal distribution, in which all values in the sample are distributed equally above and below the mean. It is expected that subsequent studies will be able to identify the reasons for persistence of the “fat tail” and resolve the same.
Export Release Time – getting there
To realize the full benefits of trade facilitation, it is important that export release time is significantly reduced as well, as underscored by India’s NTFAP, which has set the target for export release time at half of the import release time.
However, for a variety of reasons, including challenges in obtaining data and the significantly lower role of regulatory authorities, it is only with JNCH TRS 2018 that export release time began to be measured. Early TRS initiatives relied on data extracted from the Customs automated system, primarily focusing on the time taken from shipping bill submission to the grant of the Let Export Order (LEO), a document provided when Customs is satisfied with the assessment of the value of the goods and their inspection. However, since shipping bills are submitted well before the arrival of cargo at Customs stations and various time-consuming processes take place after the LEO, the NTRS measures the time taken from arrival of the cargo at the Customs stations till the departure of the vessel/aircraft/truck or loading on the rake. To undertake this comprehensive measurement, data sourced from the Customs automated system and the IT systems of relevant custodians is merged using the shipping bill as the identifier.
The NTRS recognizes the distinction between regulatory clearance (also referred to as Customs release), which gets completed with the grant of the LEO, and the wider physical clearance, which gets completed with the departure of the vessel/carrier with the goods. Adopting this categorization and the WCO definition of average release time, the data presented by NTRS 2023 revealed that the average export release time generally improved in 2023 vis-à-vis 2021, albeit with a general deterioration in 2022.

As observed from the findings of NTRS 2023, the proximate reason for high export release time is evidently the time taken post regulatory clearance, after the grant of the LEO till departure of the export cargo, as summarized in the table below.

It is observed that the average time taken in granting regulatory clearance largely meets the NTFAP targets. However, the export release time is significantly higher than the NTFAP targets. This is primarily attributed to time taken post the regulatory clearance, largely on account of port-specific logistics and infrastructural issues, as well as the nature of the commodity being exported. Stakeholder interactions reveal that the time taken from the LEO to departure is also dependent on the frequency and controllability of the movement of the vessel/aircraft/rake/truck. The study underscores the critical role of infrastructural development in improving release times and acknowledges that the implementation of national and local projects, as part of various government schemes, would further reduce cargo release time.
TRS – a multipurpose tool
India’s experience affirms the utility of TRS as a tool for evidence-based policy, facilitating macro-level policy formulations and micro-level administrative changes to promote trade facilitation. Given the multi-stage nature of cargo clearance, evidence-based prioritization of government initiatives helps to enhance their overall effectiveness. The success of trade facilitation hinges on adoption of new enabling statutory and administrative measures. This can be encouraged through outreach programmes by the government agencies, supported by empirical evidence of substantive benefits, instilling confidence among stakeholders. Data analysis enables formulation of appropriate positive or negative “nudges” or even necessary changes in statutory provisions. Engaging all relevant stakeholders in conducting the TRS can contribute to enhanced coordinated border management at national, regional, and international levels, thus fostering inter-agency cooperation.
Measure what matters
The regular conduct of TRS has showcased India’s advancements in trade facilitation and is complemented by progressive sophistication in the timely publication and reporting of data relating to the same. The significance of TRS underscores that performance measurement forms the bedrock of modern Customs administrations and concerns the ongoing monitoring and reporting of the progress towards reaching organizational goals. To enable an evidence-based approach to policy making, performance measurement must be regular and robust, supported by an effective feedback mechanism that facilitates appropriate policy modifications and sophistication in the performance measurement.
Moving ahead
It is expected that the role of performance measurement to assist trade facilitation will continue to be recognized, with various indicators adopting different methodology being reported by states, multi-lateral agencies and private agencies.
WCO has recently proposed a Performance Measurement Mechanism (PMM), a comprehensive framework to assess Customs efficiency and effectiveness. PMM objectives under the dimension “Trade Facilitation and Economic Competitiveness” include the objective “Smoother movement of goods”, which has three KPIs: physical release time for import, physical release time to export from the lodging of the export declaration, and physical release time to export from the arrival of goods at places under Customs supervision. For each of those KPIs, the TRS is a source of verification, among others. The TRS is once again recognized as a key tool to measure trade facilitation performance, and having the force of a global agreement behind it, should be Customs’ preferred tool.
CBIC is keen to participate in the PMM and it would be interesting to watch how PMM grows to acquire its own position among different performance measurement systems, such as the OECD set of Trade Facilitation Indicators (TFIs) and the World Bank Logistics Performance Index (LPI).
More information
vschauhan67@hotmail.com
sruti.vijayakumar@gov.in
[1] https://www.wto.org/english/tratop_e/tradfa_e/tradfa_e.htm#III
[2] https://www.wto.org/english/docs_e/legal_e/tfa-nov14_e.htm#art7
[3] https://www.tfadatabase.org/en/members/india
[4] See JNCH website (https://www.jawaharcustoms.gov.in/searchResult.aspx?SearchQry=Time%20Release%20Study) and CBIC website (https://www.cbic.gov.in/entities/cbic-content-mst/NTE2)
[5] https://www.tfadatabase.org/en/trade-facilitation-committee/experience-sharing/all
[6] https://www.wcoomd.org/-/media/wco/public/global/pdf/topics/facilitation/instruments-and-tools/tools/time-release-study/trs-guide_en.pdf
[7]https://mag.wcoomd.org/magazine/wco-news-86/assessing-the-clearance-process-india-shares-its-experience/#:~:text=It%20showed%20that%20the%20average,found%20to%20be%2035.4%20hours
[8] https://carnegieindia.org/2021/05/17/measuring-trade-facilitation-evidence-from-india-pub-84456
[9] https://www.cbic.gov.in/entities/cbic-content-mst/MjEwMDA%3D
[10] The reported data is not comparable to average release time reported by NTRS and average dwell time reported by DTR, since ICEDASH reports the average time taken in cargo cleared on a particular day.
[11] However, the earliest quantitative assessment of the average import release time is documented in the Performance Audit Report 2015 of the Comptroller and Auditor General of India for the year 2010-11.
[12] NTRS 2023, page 7.
[13] See the article published in Issue 3 / 2023 of WCO News: https://mag.wcoomd.org/magazine/wco-news-102-issue-3-2023/how-indian-customs-leverages-data-analytics-for-efficient-risk-management/

