
A method for measuring trade facilitation
20 March 2018
By Dr Andrew Grainger and Dr Duncan R. ShawWith its recent ratification in February 2017, the World Trade Organization’s (WTO) Trade Facilitation Agreement is now in force. This is fantastic news for making trade simpler, and for taking advantage of the subsequent economic rewards. However, the question of how to hold countries, administrations and operators accountable to making things simpler, is still open. We argue that although making sure that trade facilitation measures are in place is good, it is the quality of implementation that will deliver the economic benefits. What is now needed is a method for measuring the quality of trade facilitation, and for acting on what has been measured.
Without a robust approach to measuring trade facilitation there is a real risk that:
- Reform will predominantly focus on the obligations set out in the WTO Trade Facilitation Agreement (see Table 1 ), while other opportunities to make significant improvements are overlooked (e.g. the operational interactions between shipping lines, port stevedores and Customs, the practicalities of making payments for inspection related services, or the ease of use of supporting electronic systems);
- The wrong reform priorities are made, and scarce resources are not put to best use;
- A lack of ownership, especially where trade facilitation measures cut across administrative and organizational boundaries, will make excuses easy.

What do we know so far?
Luckily, we do not need to start from scratch. In trade facilitation, several standard performance measurement methods have already been developed with different levels of focus. They include:
- the country level macroperspective, such as the World Bank’s Logistics Performance Index and Doing Business datasets, or the Organisation for Economic Co-operation and Development’s (OECD) trade facilitation indicators;
- the country level micro-perspective, such as the United Nations Economic and Social Commission for Asia and the Pacific’s (UN ESCAP) approach to business process analysis in specific industry sectors;
- the agency specific perspective, such as the WCO’s time release studies for Customs administrations.
We also know that performance management as a science is well established; it benefits from a rich literature and is taught at most business schools; and many lessons can be taken from private sector experiences. One dominant idea is that of the “balanced score card” – or “dashboard” – in supporting decision-making [1]. It recognises that in any organization different stakeholders have different information needs. These might be:
- outward looking, such as when reporting to investors;
- inward looking, such as when looking at operations;
- customer orientated, such as when trying to assess market opportunities;
- focused on innovation and learning, such as by learning best practices from others, or by developing and investing in new technologies.
Each of these perspectives draws on qualitative and quantitative measures – so called “key performance indicators” (KPIs). These have two principal purposes. The first is to monitor performance and hold someone accountable. The second is to communicate targets and aspirations. In the context of trade facilitation there is scope to develop and agree KPIs, too – preferably across the international trade system, as opposed to just the internal KPIs that some Customs administrations and others already use [2].
Measuring trade facilitation
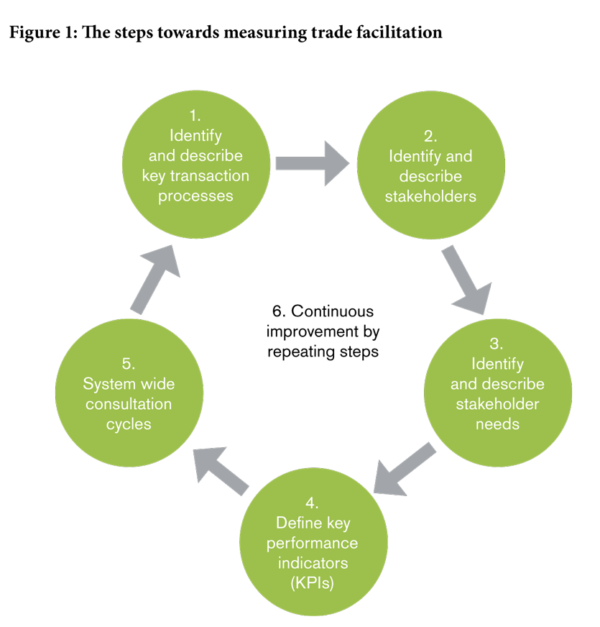
We suggest six steps (see Figure 1) based on what different stakeholders in the key transaction processes linking business and government consider to be important. If the key stakeholders are happy then the processes will run smoothly
Step one: To identify and describe key processes. Fortunately, much of the work has already been done. Notable work includes the United Nations Economic Commission for Europe’s (UNECE) supply chain reference model [3] , but there are many other models, too.
Step two: To describe the various stakeholders and their operations along the supply chain – from buy, to ship, to pay. Private sector stakeholders include: traders, such as importers, exporters, and their agents (they may be big or small, experienced or inexperienced); intermediaries, those that offer transport and transport related services, ranging from shipping to finance and insurance; and owners and operators of trade facilities and infrastructure, ranging from ports to trade-related information technology (IT) services. Government stakeholders include: Customs and nonCustoms agencies; policy holders and executive agencies; and agencies at home and in partnering countries.
Step three: To capture stakeholders’ needs. Needs are subjective, so they will be different for each type of stakeholder. For example, “just-in-time” may be about speed for some, but for many it is more about reliability (i.e. not too late).
Step four: To define appropriate KPIs, recognizing that they, too will be diverse and dependent on the specific requirements of the company or organization, the sector they are in, the supply chain arrangements, and the capabilities of the various stakeholders.
Step five: To consult and share experiences, including KPI data, and then analyse that data for policy making purposes. This also provides opportunities to review the preceding steps, to identify inefficiencies that undermine their performance, and to identify scope for making improvements.
Step six: A commitment to continuous improvement, which provides an opportunity to review the usefulness of KPI’s, and perhaps make adjustments.
A new world of sensible data sharing
One further driver for the above approach is to take advantage of new technologies and data that is already being collected. Indeed, Customs agencies and the trade facilitation community are increasingly aware of the modern data pipeline. They recognize that all data for regulatory purposes has already been captured within commercial systems well before being formally submitted to government agencies [4] .
But there is more. Nearly everything we do produces an electronic shadow. The challenge is to work out when and under what conditions it is right to draw upon it. When and under what conditions will owners of such data be willing to share? And how to work out who has what information. There are many opportunities to use data that is the by-product of other activities to measure performance. We just need to start a conversation about what is available, and who may find the data useful.
Stepping stones
Before we can use all the data that different stakeholders produce, to improve trade facilitation we also have to learn how to share data between stakeholders. One first step might be to start building a directory of trade facilitation related datasets. A bit like the “yellow pages” – somewhere where people can look-up who has performance related information about what. Who has the information which can help you run operations more smoothly, telling you where things are not performing?
There are plenty of anecdotes, for example, where freight forwarders can give a clearer picture about an administration’s performance than the administration itself. We ask, what would it take to sensibly share that information on a day-to-day basis?
Supporting institutions will be necessary, such as National Trade Facilitation Committees (NTFCs), Customs consultative groups, and port user groups. By drawing on the information they have, KPI’s can be identified and monitored.
Nothing needs to be perfect from day one, but we sense that there is a good research opportunity. And as researchers, we would be keen to develop funded pilot studies, perhaps with a specific sector focus, or along a specific trade lane. Volunteers are always welcome!
More information
grainger@tradefacilitation.co.uk
duncan.shaw@nottingham.ac.uk
References
- Kaplan, R.S. and David P Norton, The Balanced Scorecard-Measures That Drive Performance, Harvard Business Review, 1992, 70(1): p. 71-79.
- Cantens, T., R. Ireland, and G. Raball, Reform by Numbers, 2012, Washington: World Bank.
- UNECE, International supply chain reference model (ISCRM), 2012 [cited 2017 20 Dec]; http://tfig.unece.org/contents/ISCRM.htm.
- Hesketh, D., Seamless electronic data and logistics pipelines shift focus from import declarations to start of commercial transaction, World Customs Journal,
2009, 3(1): p. 27-32.